Happiness Data Report for August: Air That You Breathe
We are all connected through the air we breathe. The air you breathe is the same air that your ancestors breathed and that future generations will breathe. It is the same air your neighbor breathes, the same air breathed by seven billion people on our planet - and all other beings.
Air knows no boarders, no boundaries, makes no distinctions.
Thank goodness.
We humans can't survive more than three minutes without air. Try holding your breathe, and you'll have a direct experience of how connected your well-being is to air.
What does air have to do with happiness?
One of the questions in the Happiness Index is: How satisfied are you with the air quality in your environment?
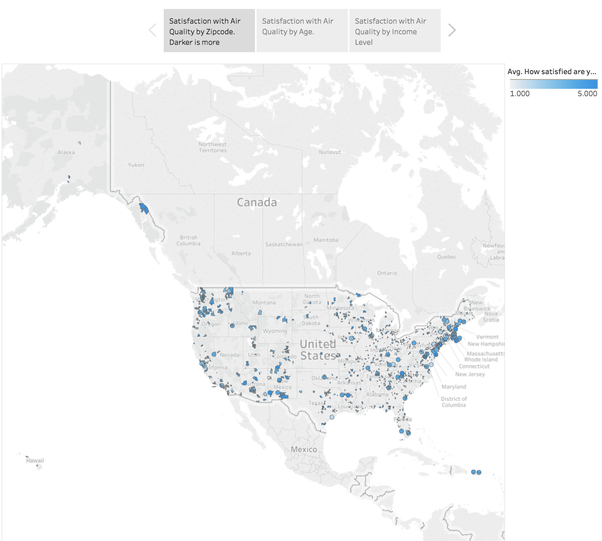
The map below (click here to interact with the data) shows darker blue where people have higher satisfaction with air quality, and lighter colors where there is lower satisfaction with air quality. (Where there is data, there is a dark grey circle with the color inside. Light grey is where there is no data yet).
Overall, in 2017, people were fairly satisfied with the air quality in their environment.
Objective data (data that can be observed) can help give a balanced picture when compared to subjective data.
Objective data is data that can be observed, like particulates in the air.
Subjective data is gathered through surveys, like the Happiness Index.
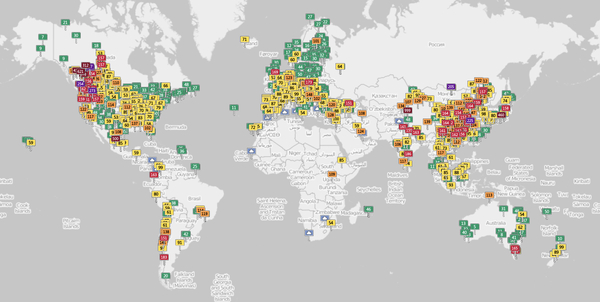
The Real Time Air Quality Index provides objective data for air quality. In areas where people are fairly satisfied (or not dissatisfied) with air quality, the air quality (measured in terms of pollutants, pollen, ozone and other factors of air quality,) is only moderately good in many areas (yellow) and unhealthy or very unhealthy in other areas (red and purple respectively).
Comparing the data suggests there may be a disconnect between how satisfied we are with our air quality and our actual air quality; and an even deeper disconnect with how we feel today about our air quality, the future of our air quality and our happiness.
We can't say that for sure, because of many factors. But we can suggest that this is an area worth investigation.
Why look at the differences between air quality measured in terms of pollutants and people's satisfaction with air quality?
- Because since the industrial revolution, overall air quality has gotten worse (even though since the 1970s, in some areas it is getting better), and we can't be certain that nature will bear every nation catching up so that it gets better in all areas.
- Because with the impacts of climate change such as water scarcity, forest fires and desertification in some areas, and longer growing seasons with high pollen counts in other areas, we can expect some major impacts on air quality.
- Because we humans are gifted and cursed with an ability to adapt and a preference for short term thinking over long term thinking.
- Because we often don't think of the connection between air quality and happiness until we can't hardly breathe.
- Because we often wait to take action until we reach a personal or societal crisis.
- Because it feels overwhelming.
So what can you do right now to make a difference?
How You Can Take Action Today:
- Share the Happiness Report Card and this month's report about air quality with your mayor, elected council members, city or town manager, governor and senator. Ask to have a conversation with them about the Happiness Movement. (You can find resources, including a white paper on the Happiness Movement here)
- Ask your friends and colleagues to take the Happiness Index and coordinate conversations to discuss their happiness scores.
- If you are a researcher, conduct an investigation into the connections between objective and survey-based data for air quality and happiness. (You can use the Happiness Index data; email info@happycounts.org).
A Bit More On Data...
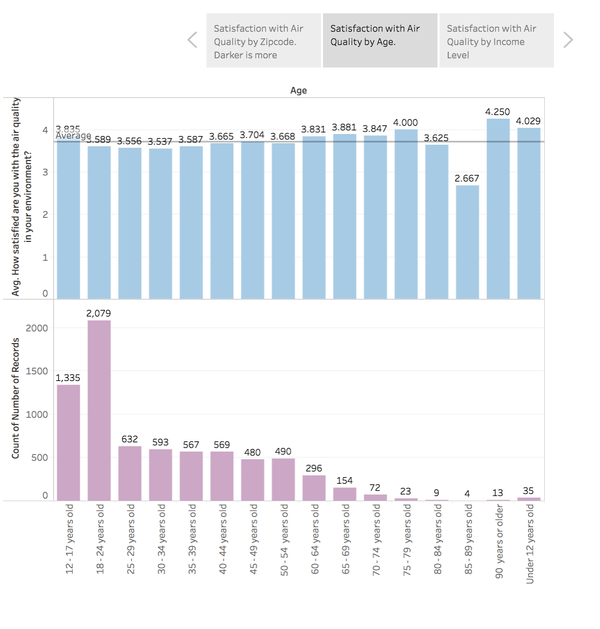
Looking at the differences in satisfaction with air quality between ages, the Happiness Index, data shows that except for very few 85-89 year olds, we were satisfied with our air quality in 2017.
A lot more youth took the survey than adults, and a lot fewer older people took the survey than adults or youth. If this were a random sampling, the few people in the 85-89 year old bracket might be called outliers, and their data would not be included. But our data comes from a convenience sampling, meaning everyone who takes the Happiness Index made the personal decision to do so.
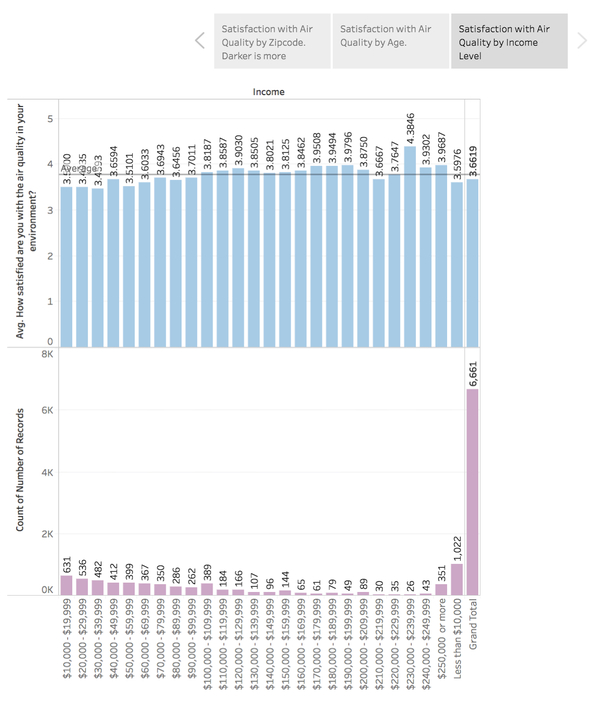
Looking at the differences between income levels, except for the 43 people whose household income is between 240,000-250,000USD a year (they were more satisfied), most everybody was pretty satisfied with the quality of their air.
Other than that, the differences between the very wealthy and poor were small, but many more people on the low income spectrum took the survey than people in the wealthy income brackets.
(A score of 5 means very satisfied, a score of 3 means neither satisfied or dissatisfied, and a score of 4 means satisfied.)
and...FYI:
Happiness Agoras: Stream, Participate, Play
Luis Gallardo's Happiness Agoras are open to everyone online for a low price of 39.99. Sign up for one week of inspirational sessions online the week of International Day of Happiness (March 21) in 2019.


No comments:
Post a Comment